Phylogenetic, ecological and biomechanical constraints on larval form: a comparative morphological analysis of barnacle nauplii
Abstract
Barnacle naupliar larvae are differentiated from other zooplankton by their unique pair of frontal lateral horns, frontal filaments, and a pear-shaped cephalic shield. Their morphology impose constraints on their ecological functions and reflect their evolutionary history. To explore the potential functional basis underlying the similarities and differences in barnacle larval form, we conducted a meta-analysis on the shape of the barnacle nauplii’s cephalic shield and examined its relation to larval size, trophic mode, pelagic larval duration and habitat. Nauplii cephalic shield morphology of 102 species were quantified with normalized elliptic Fourier analysis. Most of the species were distributed around the center of the morphospace but a few extreme groups occupied the periphery: nauplii that were large and lecithotrophic. Subsequent principal component regression analyses showed that larval size was a good predictor of the first shape variations axis (aspect ratio). After allometry adjustment, nauplii from different trophic modes differentiated along the second axis of the major shape variations (relative frontal horn length). Habitat was a poor predictor of variations in naupliar body form, but it could be used to differentiate extreme morphology groups from other nauplii. Our result suggests that size-related biomechanical or developmental constraints and feeding requirements are important in shaping the evolution of the naupliar body form. Within the limitations of these functional constraints, habitat drives the divergence of extreme morphology groups from the majority of species. Our comparative morphometrics analysis demonstrated how variations in larval body form can be quantitatively linked to the functional needs that constrain or drive their diversity, and inform further empirical experiments on larval functional morphology.
Interactive plots
Figure 1
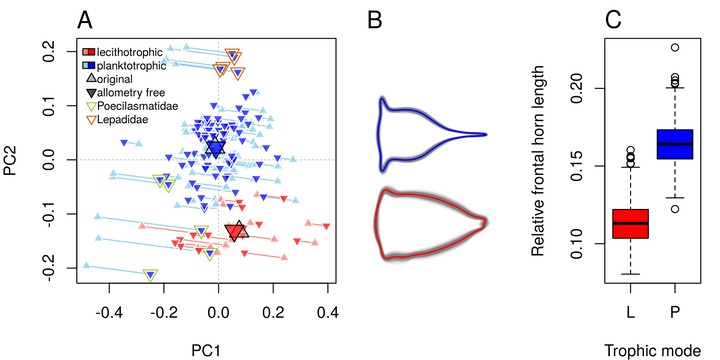
B
Outline reconstructed from elliptic Fourier analysis. Drag the slider to view reconstructed outlines using different number of harmonics. Note how quickly the outlines change in the first 20 harmonics but little improvement after that.
Figure 2
A
Plot of first two principal component scores from principal component analysis (PCA) on outline shape of stage II barnacle nauplii. Mouse over to see species name and other information of data points.
Figure 3
B
Shape score associated with size estimated from multivariate regression of shape of nauplii outlines on size. Mouse over to see species name and other information of data points.
C
Predicted shapes from regression of shape on size. Drag the slider to view predicted shapes at different percentiles of size.
Figure 4
A
Drag the slider to view what allometry adjustment does to the PCA morphospace.
Figure 5
Use drop down menu to view the sub-plots: A) phylomorphospace and adult habitats; B) larval habitats; and C) nauplius duration. Mouse over to see species name and other information of data points.